On the first page of his first data visualization book, Mr Edward Tufte
states his fundamental beliefs about data visualization. One of his
principles corresponds to encouraging the eye to compare the different pieces of
data. I wasn't very sure what he meant by that until I came across some of the classic works of visualizations. One can easily recognize and appreciate the thoughtfulness and arduous efforts of these data artists.
John Snow's Cholera Map

By John Snow - Published by C.F. Cheffins, Lith, Southhampton Buildings, London, England, 1854 in Snow, John. On the Mode of Communication of Cholera, 2nd Ed, John Churchill, New Burlington Street, London, England, 1855. (This image was originally from en.wikipedia; description page is/was here. Image copied from http://matrix.msu.edu/~johnsnow/images/online_companion/chapter_images/fig12-5.jpg), Public Domain, Link
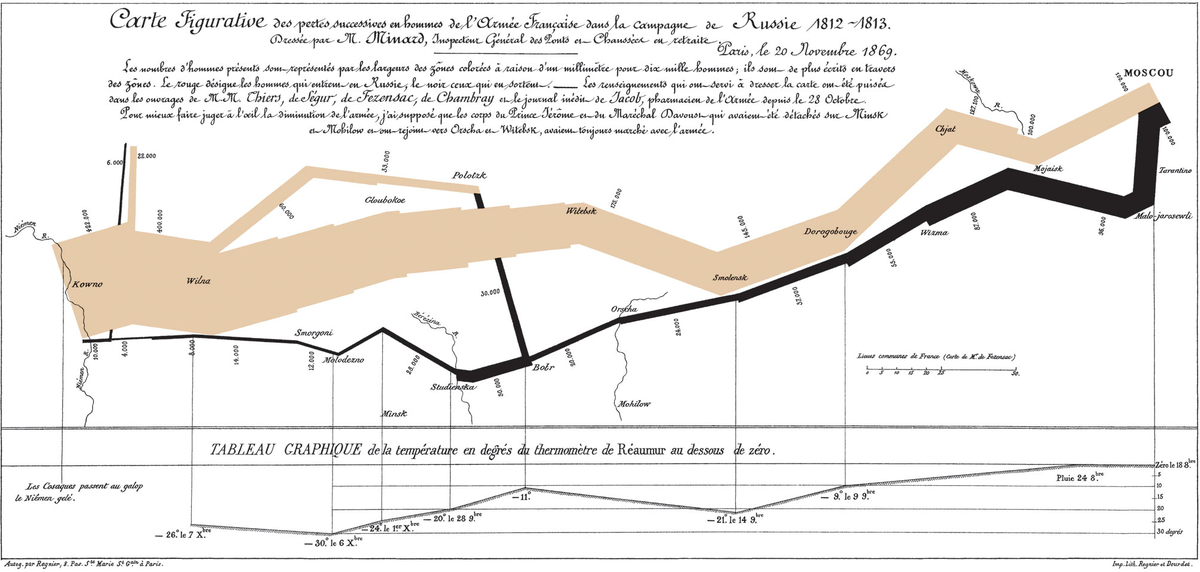
Charles Joseph Minard's chart of Napoleon's Invasion of Russia

By Charles Minard (1781-1870) - see upload log, Public Domain, Link
William Playfair's Quarterly Wheat and the Wages Graph

By Playfair, William, 1759-1823
John Snow's Cholera Map

By John Snow - Published by C.F. Cheffins, Lith, Southhampton Buildings, London, England, 1854 in Snow, John. On the Mode of Communication of Cholera, 2nd Ed, John Churchill, New Burlington Street, London, England, 1855. (This image was originally from en.wikipedia; description page is/was here. Image copied from http://matrix.msu.edu/~johnsnow/images/online_companion/chapter_images/fig12-5.jpg), Public Domain, Link
Charles Joseph Minard's chart of Napoleon's Invasion of Russia

By Charles Minard (1781-1870) - see upload log, Public Domain, Link
William Playfair's Quarterly Wheat and the Wages Graph

By Playfair, William, 1759-1823
No comments:
Post a Comment