Binomial experiment has following characteristics:
- The process consists of sequence of n trials.
- Only two exclusive outcomes are possible in each trial. One outcome is called success and other is called failure.
- The probability of success is denoted by p and it does not change from trial to trial. It means probability of failure is (1 - p) and that is also fixed for trial to trial.
- The trials are independent and outcome of any trial do not influence future trials.
Some common notations,
n: Number of trials
x: Number of successes
P: Probability of success

Lets visualize couple of scenarios,

In the screenshot above first example is of,
n = 5
x = 2
the second example is of,
n = 5
x = 4
Ofcourse there are other ways then shown in screenshot above for given values of x and n.
Lets try to understand all possible ways in which this can happen for,
n = 5
x = 4

Now lets take one example and try to solve it.
Problem 1: A (very poor) manufacturer is making a product with 20% defect rate. If we select 5 randomly chosen items at the end of assembly line, what is the probability of finding one defective item in our sample.
So lets enlist all the ways in which (exactly) 1 product can be defective.

Now lets convert this into probability based table,

In the screenshot above we can see the general formula, where
n: Number of trials
x: Number of successes
P: Probability of success
So based on this formula we can calculate all number of successes immediately:

Lets have one more example,
As a sales manager you analyze the sales records for all salespersons under your guidance. Joan has success rate of 75% and averages 10 sales call per day. Margo has a success rate of 45% and averages 16 calls per day. What is the probability of each sales person making 6 sales on any given day.
Using the formula we have,

.
.

Lets build the distribution graph using value we can get by the formula, which can help us to answer similar questions.
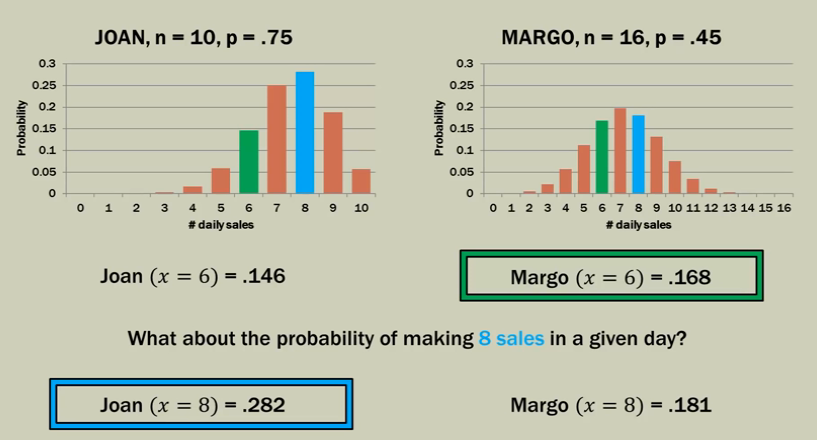
Now as we can see above, the distribution helps us to answer similar question or to evaluate salespersons.
Source: Statistics 101: The Binomial Distribution
No comments:
Post a Comment